Your payouts dropped this month, or they rose and you're not sure why. A bank balance can't tell you whether you sold fewer nights, sold them cheaper, or lost more of each booking to fees. Five short-term rental KPIs can, and you can calculate all of them from one month of reservations.
Start with one action today: export last month's reservations from every channel you use, including direct bookings, into one sheet with one row per booking. Every metric below comes from that sheet.
Which short-term rental KPIs should you track?
Track five: occupancy rate, average daily rate (ADR), RevPAR, net revenue per booked night by channel, and booking lead time. Together they separate a demand problem from a pricing problem from a fee problem.
The first three are standard lodging metrics. The last two are what most hosts skip, and they're often where the money goes.
| KPI | Formula | Question it answers |
|---|---|---|
| Occupancy rate | booked nights ÷ available nights × 100 | Are enough nights selling? |
| ADR | nightly revenue ÷ booked nights | What do the nights you sell earn? |
| RevPAR | nightly revenue ÷ available nights, or ADR × occupancy | Is the whole calendar earning more? |
| Net ADR by channel | (nightly revenue − platform and payment fees) ÷ booked nights, per channel | How much of each night do you keep? |
| Booking lead time | check-in date − booking date, in days; track the median | How far ahead do guests book you? |
Each of the first three has its own detailed guide, so this post won't repeat the edge cases. For which nights count as "available," see how to calculate occupancy rate. For cleaning fees, discounts and long stays in ADR, see average daily rate on Airbnb. For why RevPAR can rise while your business gets worse, see RevPAR for short-term rentals.
Two rules keep the numbers comparable month to month. Leave cleaning fees out of nightly revenue, and count every channel's bookings, not just Airbnb's.
How do you calculate Airbnb financial metrics from one month of bookings?
Put every booking in one sheet, add up nights and nightly revenue, then subtract each channel's fees booking by booking. Here is the full calculation for a hypothetical unit so you can check your own formulas against it.
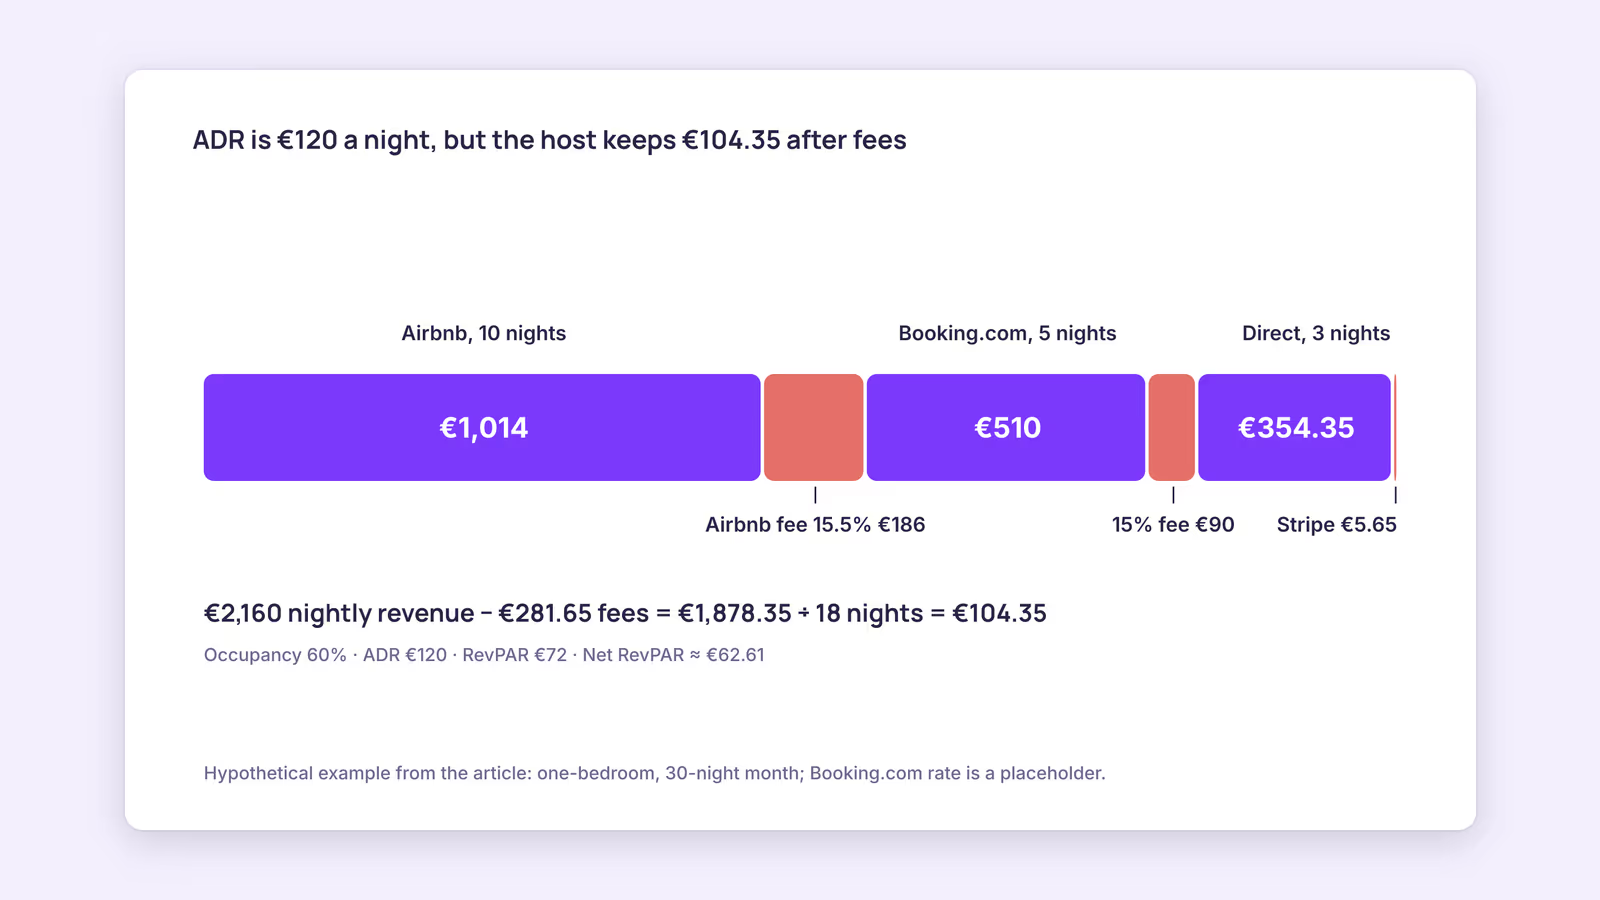
Consider a hypothetical one-bedroom apartment in a 30-night month with no owner stays or maintenance blocks. It had six bookings for 18 nights, earning €2,160 in nightly revenue. To keep the math readable, it charges no cleaning fee.
The three standard metrics:
- Occupancy: 18 ÷ 30 × 100 = 60%
- ADR: €2,160 ÷ 18 = €120
- RevPAR: €2,160 ÷ 30 = €72, which matches €120 × 60%
Net ADR by channel. This is where fees show up. Airbnb's service fee article says most hosts on the single-fee structure pay 15.5%, calculated on the nightly price plus host fees such as cleaning, excluding taxes. Booking.com's commission article says commission is a set percentage of the total booking amount, and the exact rate depends on your country, property type and agreement, so the 15% below is a placeholder. Swap in the rate from your own contract. For the direct booking, the example uses Stripe's published Ireland rate for standard EEA cards, 1.5% + €0.25 per charge.
| Channel | Bookings | Nights | Nightly revenue | Fee assumption | Fees | Net | Net per night |
|---|---|---|---|---|---|---|---|
| Airbnb | 3 | 10 | €1,200 | 15.5% single fee | €186.00 | €1,014.00 | €101.40 |
| Booking.com | 2 | 5 | €600 | 15% placeholder | €90.00 | €510.00 | €102.00 |
| Direct | 1 | 3 | €360 | 1.5% + €0.25 | €5.65 | €354.35 | €118.12 |
| Total | 6 | 18 | €2,160 | €281.65 | €1,878.35 | €104.35 |
So the headline ADR is €120, but the host keeps about €104.35 per booked night after channel fees. Net RevPAR is €1,878.35 ÷ 30 ≈ €62.61. Direct bookings made up one of six bookings and 3 of 18 nights, about 16.7% either way.
If you charge a cleaning fee, add it to each booking's fee base. Both Airbnb and Booking.com charge on it, even though it stays out of ADR. If you use Payments by Booking.com, its payments page says payment service fees are deducted alongside commission, so add those too.
What this suggests: in this example, a night moved from Airbnb to direct keeps about €16.72 more. That's before whatever you spend to get direct guests to find you, so treat it as a ceiling, not a saving.
Booking lead time. Suppose the six bookings were made 4, 9, 18, 26, 40 and 55 days before check-in. The median is (18 + 26) ÷ 2 = 22 days. Use the median, not the average, because one booking made months ahead can drag an average far from your typical guest.
What do your short-term rental metrics tell you when revenue changes?
Read them in order: RevPAR says whether the calendar earned more or less, occupancy and ADR say why, net ADR says how much reached you, and lead time says whether upcoming dates are on track.
Use this diagnostic table when a month looks off. It compares a month with the same month last year, or with your last normal month.
| What you see | Metric that moved | First thing to check |
|---|---|---|
| Revenue down, calendar as full as before | ADR down, occupancy flat | Discounts, length-of-stay pricing, nights sold far below your base price |
| Revenue down, prices unchanged | Occupancy down | Blocked dates counted as available, listing changes, empty dates inside your usual lead time |
| Revenue up after a price increase | ADR up, occupancy down | Whether RevPAR actually rose, not just ADR |
| Busy month, thin payouts | Net ADR well below ADR | Channel mix, your Airbnb fee structure, your Booking.com contract rate, payment fees |
| Next month looks empty | Lead time vs. calendar | Whether the empty dates are still further out than your median lead time |
| Revenue from extras growing | None of the five | Add a total-revenue view, see TrevPAR |
Lead time turns the calendar into an early warning. In the example, half of bookings arrived within 22 days of check-in. Our recommendation: each week, look at nights more than your median lead time out and nights inside it separately. Empty nights beyond 22 days are normal for this unit, because most of its guests haven't booked yet. Empty nights inside 22 days have already missed the window when most of its bookings arrive, so that's where a price or minimum-stay review belongs. Your own median sets the line; there's no universal number.
Do you need software to track Airbnb key metrics?
No. For one to a few units, a spreadsheet with one row per booking handles all five metrics. Software saves time as bookings and channels grow, but only if it counts every channel and uses your definitions.
A workable sheet needs these columns: channel, booking date, check-in date, nights, nightly revenue, cleaning fee, platform fee, and payment fee. Add a small table of available nights per unit per month. From there, each metric is one formula.
Before you trust any dashboard, including a platform's own earnings view, check three things:
- Does it include bookings from every channel, or only its own?
- Is ADR gross or net of fees, and does it include cleaning fees?
- Are owner-blocked nights removed from available nights?
If a tool can't answer those, calculate the numbers yourself once and compare. A mismatch usually comes down to a definition, not an error.
When this advice does not apply
- Several units: calculate each metric per unit first, then for the portfolio. A strong unit can hide a weak one in the totals.
- Monthly stays: Airbnb pays out stays of 28 nights or more month by month rather than once, and long stays usually carry their own discounts. Track them in a separate row group so they don't distort ADR, lead time or monthly cash flow.
- VAT-registered hosts: platform fees may include VAT, and whether you can reclaim it changes your real net. Airbnb notes its service fee is VAT inclusive where applicable. Ask your accountant how to record it.
- Profitability: none of these five include cleaning, utilities, supplies or financing. They explain revenue, not profit.
What to do next
- Export last month's reservations from every channel into one sheet, one row per booking.
- Calculate occupancy, ADR and RevPAR with fixed definitions for available nights and cleaning fees.
- Add each booking's platform and payment fees from your statements, then calculate net ADR per channel.
- Calculate your median lead time and mark that many days ahead on your calendar.
- Repeat monthly and compare with the same month last year, not with last month alone.
FAQ
Should you calculate short-term rental metrics gross or net of fees?
Both. Gross ADR and RevPAR show what your listed prices produce, so use them to judge pricing. Net ADR shows what reaches your bank. Label each column so you never compare a gross number with a net one.
How often should you review Airbnb host metrics?
Monthly for occupancy, ADR, RevPAR and net ADR, since single weeks swing too much to read. Weekly for upcoming nights against your lead time, since that's the one you can still act on.
What is a good occupancy rate or ADR for a short-term rental?
It depends on your market, season and property type, so a generic benchmark can mislead. Compare each unit with its own history, and set a target for RevPAR and net ADR rather than chasing occupancy alone.
About BookBed: If net ADR shows OTA fees eating your margin, BookBed's embeddable direct booking widget takes bookings on your own site with Stripe checkout paid into your own Stripe account, with 0% commission from BookBed. You still need to bring the traffic. See plans and pricing
Sources
- Airbnb Help Center, "Airbnb service fees" — Verified 2026-09-30
- Booking.com for Partners, "Understanding your commission" — Verified 2026-09-30
- Booking.com for Partners, "Payments by Booking.com" — Verified 2026-09-30
- Airbnb Help Center, "When you'll get your payout" — Verified 2026-09-30
- Stripe, "Pricing & fees" (Ireland) — Verified 2026-09-30