You changed your prices last month and now you're staring at two numbers that disagree. Occupancy went down, the nightly rate went up, and you can't tell whether you earned more or less. RevPAR for a short-term rental settles that argument, because it folds price and occupancy into one figure per unit.
Start with one action today: for last month and the same month last year, write down three numbers per unit. Nightly revenue (no cleaning fees, no taxes), booked nights on every channel, and nights the unit was open for sale. Everything below works from those three.
What is RevPAR for a short-term rental?
RevPAR, or revenue per available room, is the nightly revenue a unit earned in a period divided by every night it was available for sale, booked or not, so empty nights pull the figure down.
Hotels use it per room. For a whole-home rental, read "room" as "unit" and "available room" as "available night." It sits on top of two metrics you may already track:
- Occupancy rate: booked nights ÷ available nights. See our occupancy rate guide for which blocked nights to remove.
- ADR (average daily rate): nightly revenue ÷ booked nights. The ADR guide covers what to include per stay.
Neither one alone tells you whether you're earning more. A full calendar at a low price and a half-empty one at a high price can land on the same revenue. RevPAR shows which one actually did.
So what is RevPAR for Airbnb specifically? The platform doesn't hand it to you directly. Airbnb's article on reading performance data for occupancy and rates defines occupancy as "the number of nights booked divided by total nights available to be booked," and average nightly rate as "total nightly revenue" divided by "the number of booked listing nights." Multiply the two and you have RevPAR on Airbnb's definitions. This suggests those figures reflect Airbnb bookings only, so if you also sell on Booking.com or direct, build your own number across channels.
How is RevPAR calculated?
RevPAR is calculated by dividing nightly revenue by available nights, or by multiplying ADR by occupancy rate; both routes give the same answer when you use the same revenue and the same nights.
RevPAR = nightly revenue ÷ available nights
RevPAR = ADR × occupancy rate
The second version works because ADR × occupancy is (revenue ÷ booked nights) × (booked nights ÷ available nights), and booked nights cancel out.
Before you plug in numbers, fix three definitions and write them at the top of your sheet:
- Revenue means nightly revenue. Leave out taxes collected for authorities and, our recommendation, the cleaning fee. It's charged per stay, not per night, so including it rewards short stays in a way that has nothing to do with pricing.
- Gross or net, but never both. Platforms take their cut from different bases. Airbnb's service fee article says the host fee applies to "the nightly price and any fees charged by the host," while Booking.com's commission page says commission is a percentage of the total booking amount, including cleaning and service fees. Gross is simpler for comparing months. Net is closer to your bank balance.
- Available nights exclude your own closures. Remove owner stays, repairs and seasonal shutdowns. Keep nights you blocked only as a sync buffer, since you still meant to sell them.
RevPAR formula example (hypothetical)
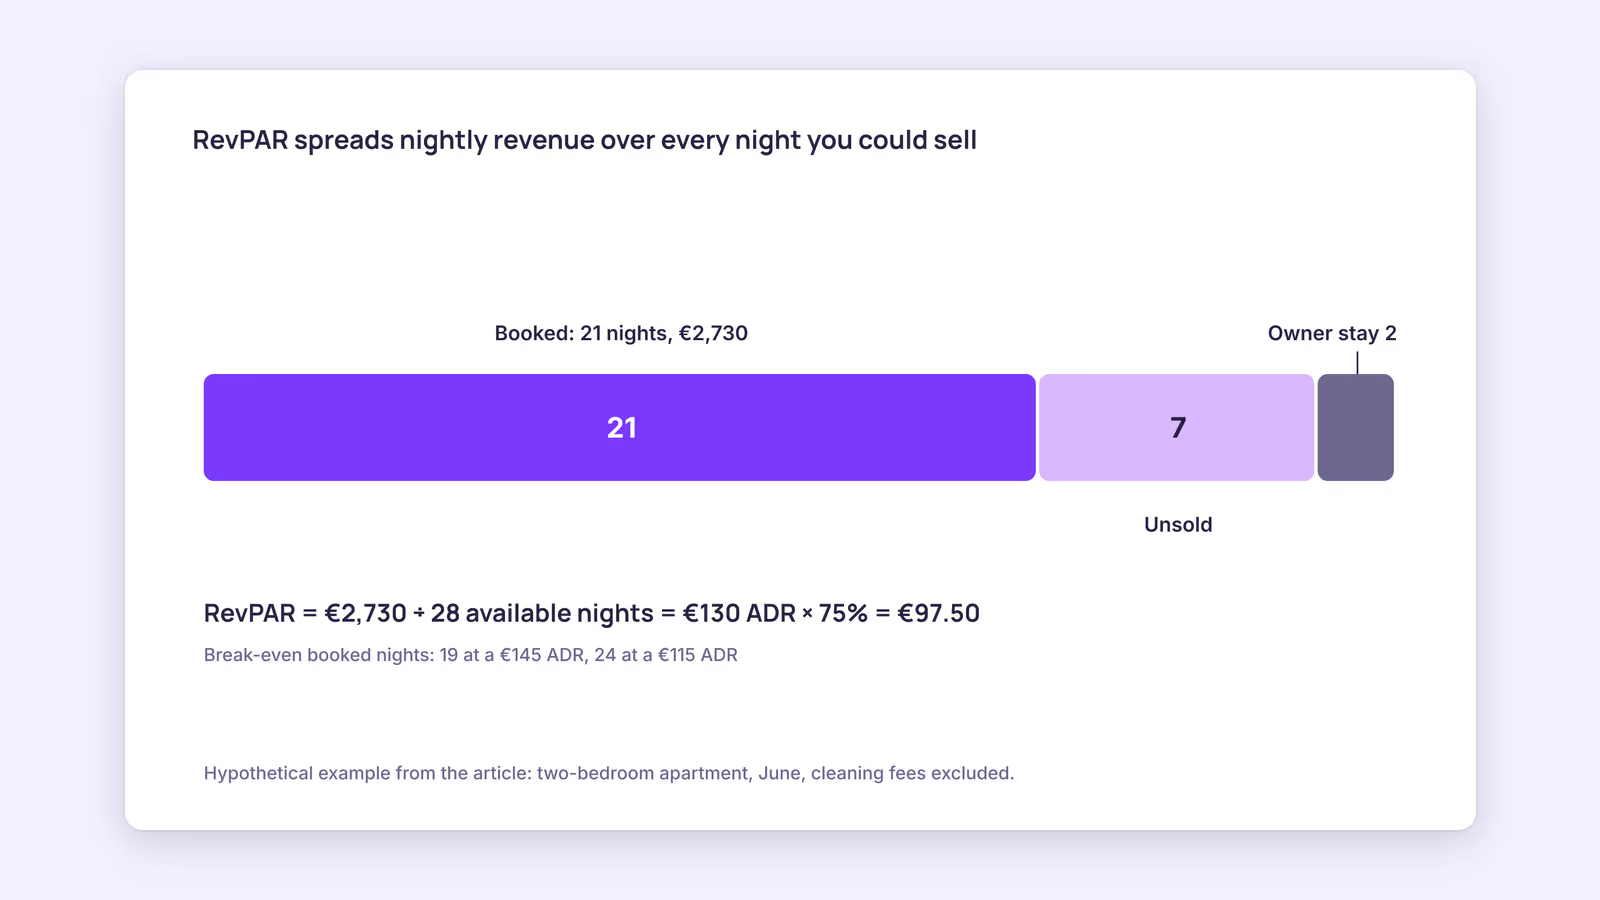
Consider a hypothetical two-bedroom apartment in June, gross of platform fees, cleaning fees excluded:
| Input | Value | How you get it |
|---|---|---|
| Calendar nights | 30 | June |
| Owner stay | minus 2 | Your choice to close |
| Available nights | 28 | 30 minus 2 |
| Booked nights, all channels | 21 | Airbnb, Booking.com and direct together |
| Nightly revenue | €2,730 | Sum of nightly prices sold |
| ADR | €130 | €2,730 ÷ 21 |
| Occupancy | 75% | 21 ÷ 28 |
| RevPAR | €97.50 | €2,730 ÷ 28, or €130 × 0.75 |
If the two routes don't agree in your own sheet, one of your inputs uses a different set of nights. That's the most common error, and the check catches it.
Did your price change raise RevPAR, or just move occupancy?
A price change raised RevPAR only if new booked nights times the new ADR beat your old nightly revenue, and you can work out that break-even point before changing anything.
Here's the test we recommend running before any price change:
Break-even booked nights = current nightly revenue ÷ new ADR
Using the hypothetical apartment above, with 28 available nights and €2,730 of nightly revenue:
| Change | New ADR | Break-even booked nights | What it means |
|---|---|---|---|
| Raise price | €145 | 18.8 | 19 or more booked nights beats today. You can lose 2 of 21. |
| Cut price | €115 | 23.7 | You need 24 or more. The cut has to win 3 extra nights. |
Check the math: 19 × €145 = €2,755, a RevPAR of about €98.39. And 24 × €115 = €2,760, about €98.57. Both clear €97.50, just barely.
Notice the asymmetry. In this example, a €15 increase can afford to lose two nights, while a €15 cut has to win three. This suggests discounting needs more new demand to pay off than a raise needs to hold, though your own numbers decide it, not this pattern.
Then read the result a month later against the same month last year, not the previous month, since seasons move occupancy on their own. One caution: Airbnb says in how search results work that listings priced below comparable nearby listings "tend to rank higher in search." A price change can shift your visibility too, so treat a single month as a signal to check, not proof of cause.
What is a good RevPAR, and when is a higher one worse?
A good RevPAR is one that beats the same unit's figure for the same month last year and covers your costs; there's no universal benchmark, because RevPAR scales with each market's prices and seasons.
We don't quote market-wide RevPAR ranges here, since we couldn't trace one to a primary source with a method that matches how hosts count nights. Your own history is the benchmark that fits.
A higher RevPAR also isn't automatically more profit. RevPAR ignores per-stay costs such as cleaning, laundry and check-in time. Suppose the hypothetical apartment sells its 21 nights as seven three-night stays in one month and as three seven-night stays in another, at the same €2,730. RevPAR is €97.50 both times. But the first month pays for seven turnovers, the second for three. If each turnover costs the same, the second month keeps more money at an identical RevPAR.
That's why you should keep a turnover count next to RevPAR, and look at net figures before calling a month a win. RevPAR also leaves out extra charges such as pet or early check-in fees. If those matter to you, track total revenue per available night alongside it, as our TrevPAR guide explains. For the revpar vs total revpar question, the short version is: RevPAR judges your nightly pricing, TrevPAR judges everything the stay brought in.
When this advice does not apply
- Multi-unit room types: if you sell several identical units under one listing or room type, count available nights per unit, not per listing, or RevPAR will look far higher than it is.
- Long stays of a month or more: monthly bookings are priced and paid differently, so mixing them with nightly stays can distort both ADR and RevPAR. Track them separately.
- Brand-new listings: a unit with only a few months of history has no same-month comparison yet. Use break-even math for decisions and wait for a full year before reading trends.
What to do next
- Build a sheet with nightly revenue, booked nights and available nights per unit, per month, for the last 12 months.
- Calculate RevPAR both ways for each month and fix any month where the two answers don't match.
- Before your next price change, work out break-even booked nights for the new ADR.
- Add a turnover count column so you can spot months where RevPAR rose but costs rose faster.
- Compare each month with the same month last year, not the month before.
FAQ
Is RevPAR the same as revenue per available night?
For a whole-home rental, yes in practice. Hotels divide by available rooms per night. With one unit, each available room-night is simply an available night, so the formula is identical.
Should I include cleaning fees in RevPAR?
Our recommendation is no. A cleaning fee is charged per stay, so including it inflates RevPAR in months with many short stays. If you want those fees counted, track them in TrevPAR instead.
Does Airbnb show RevPAR?
Airbnb's performance article defines occupancy rate and average nightly rate, not RevPAR. You can multiply those two, but they describe Airbnb's own figures, so build your own sheet if you sell on several channels.
About BookBed: BookBed Pro's multi-channel timeline view puts each unit's booked dates from Airbnb, Booking.com and your direct booking widget on one screen, which makes counting booked and available nights across channels quicker. Try BookBed Pro
Sources
- Airbnb Help Center, "How do I read my performance data for occupancy and rates?" — Verified 2026-09-30
- Airbnb Help Center, "Airbnb service fees" — Verified 2026-09-30
- Booking.com for Partners, "Understanding your commission" — Verified 2026-09-30
- Airbnb Help Center, "How search results work" — Verified 2026-09-30
- BookBed, "Pricing" (public/pricing.md) — Verified 2026-09-30